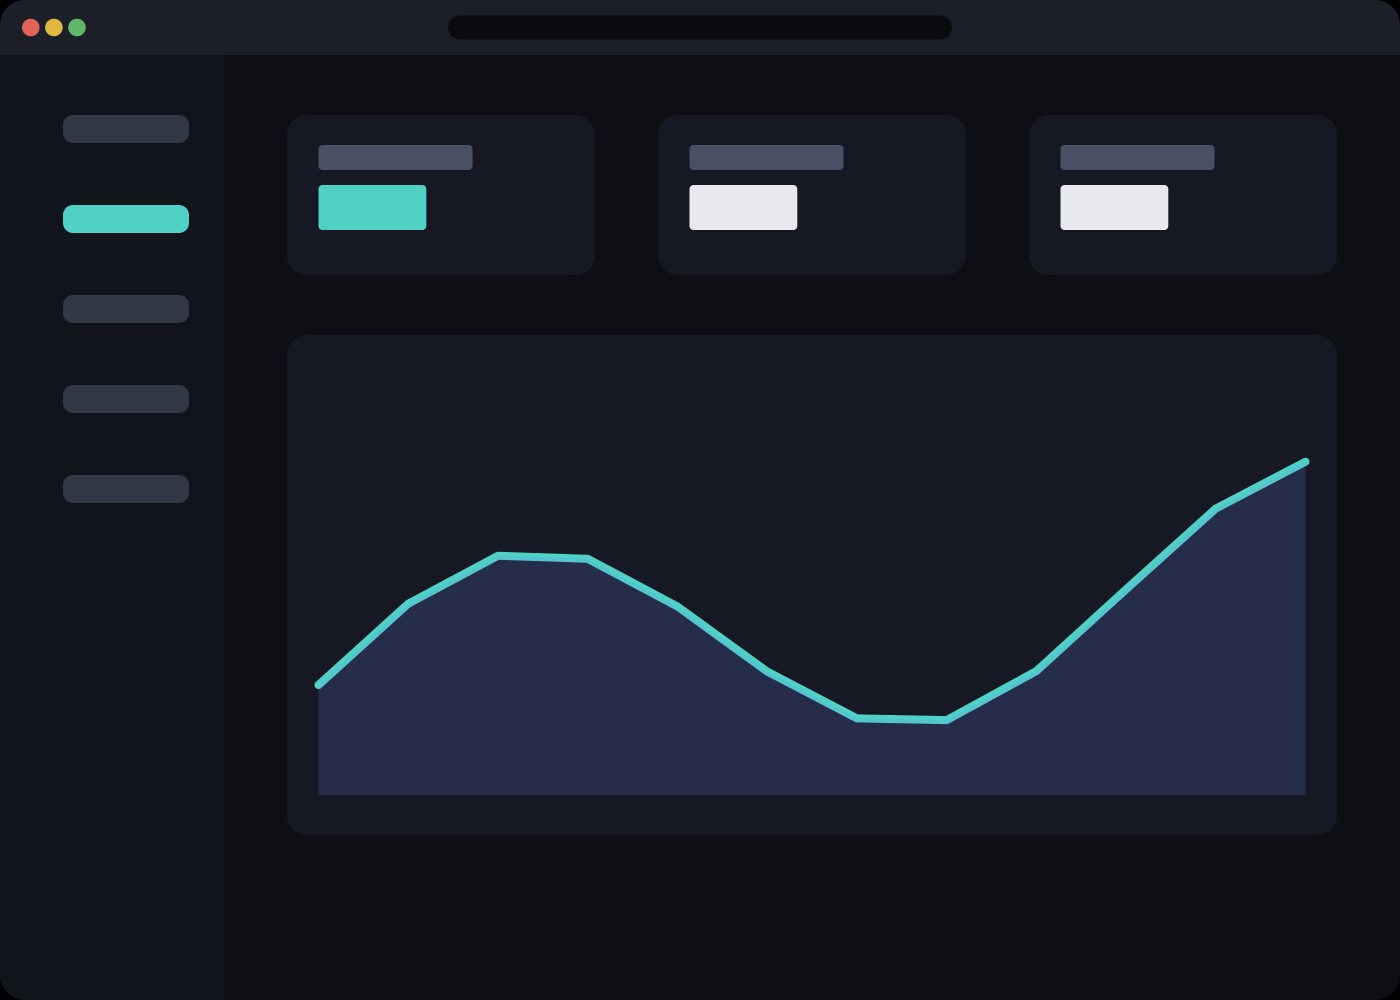
Real-time by default
Every chart updates on a live WebSocket feed, not a five-minute cron job — the dashboard reads like it’s watching the business happen, not reporting on it after the fact.
A real-time analytics dashboard built from the ground up — product design, front-end build and data visualisation in one sprint.
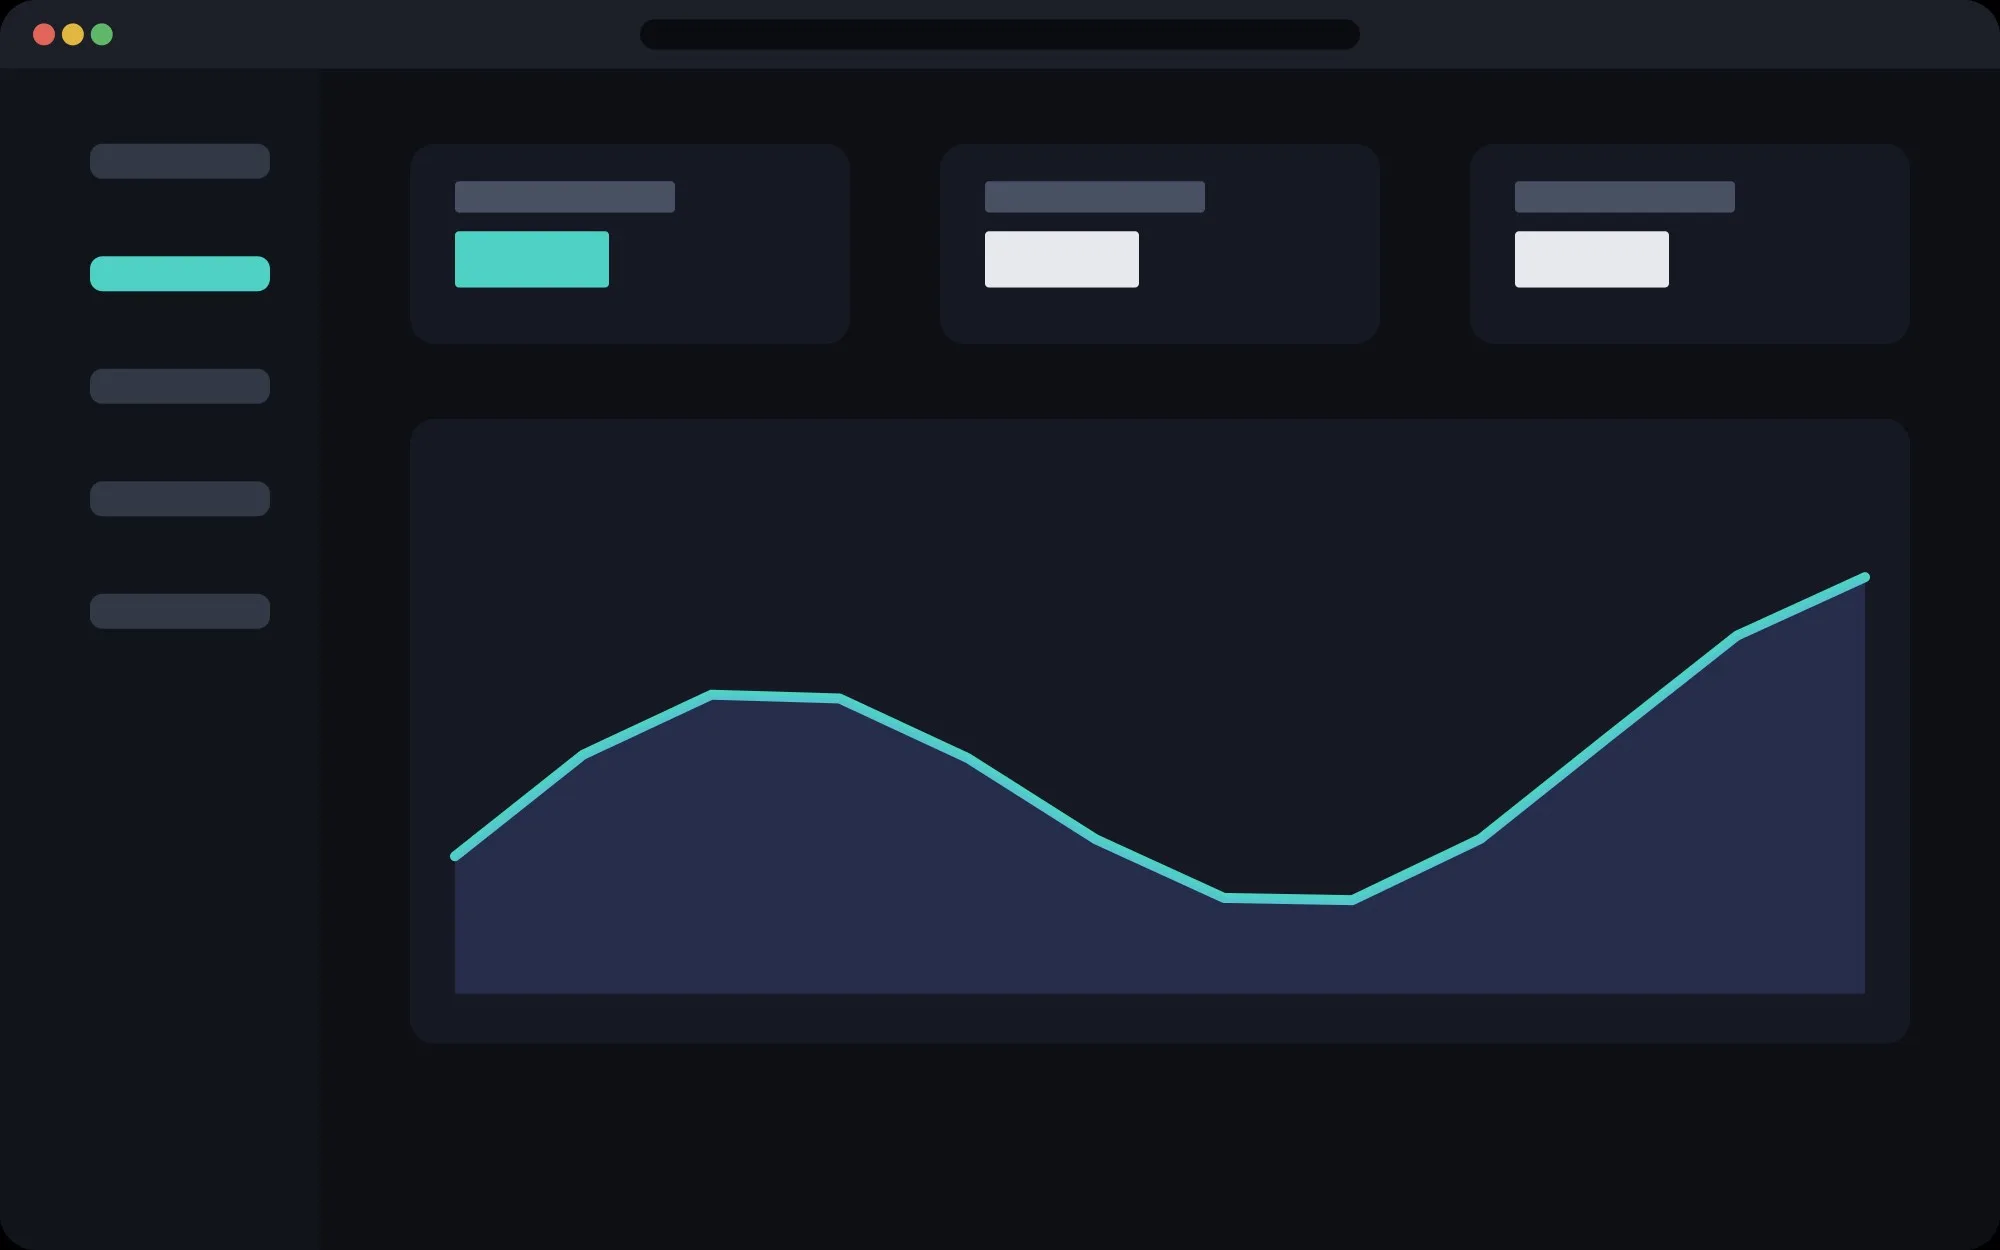
Nova’s old dashboard buried the one number that mattered under a dozen that didn’t. We rebuilt it around a single idea: show the trend first, the detail second.
Every chart updates on a live WebSocket feed, not a five-minute cron job — the dashboard reads like it’s watching the business happen, not reporting on it after the fact.
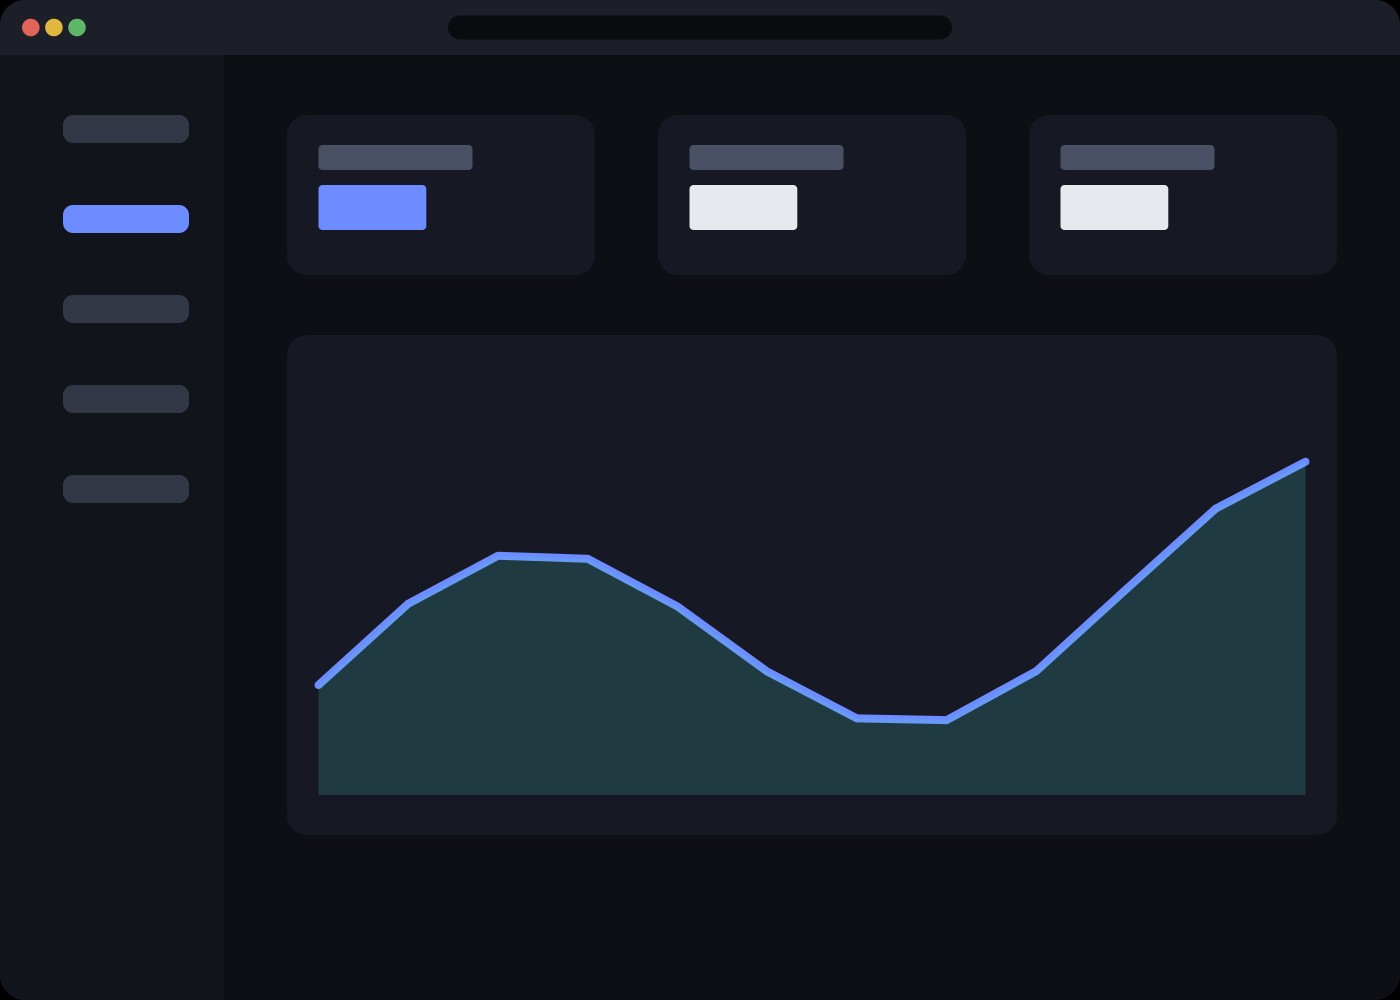
A three-column layout puts today’s anomalies on the left, this week’s trend in the middle, and the deep-dive table on the right — the order an analyst actually looks in.
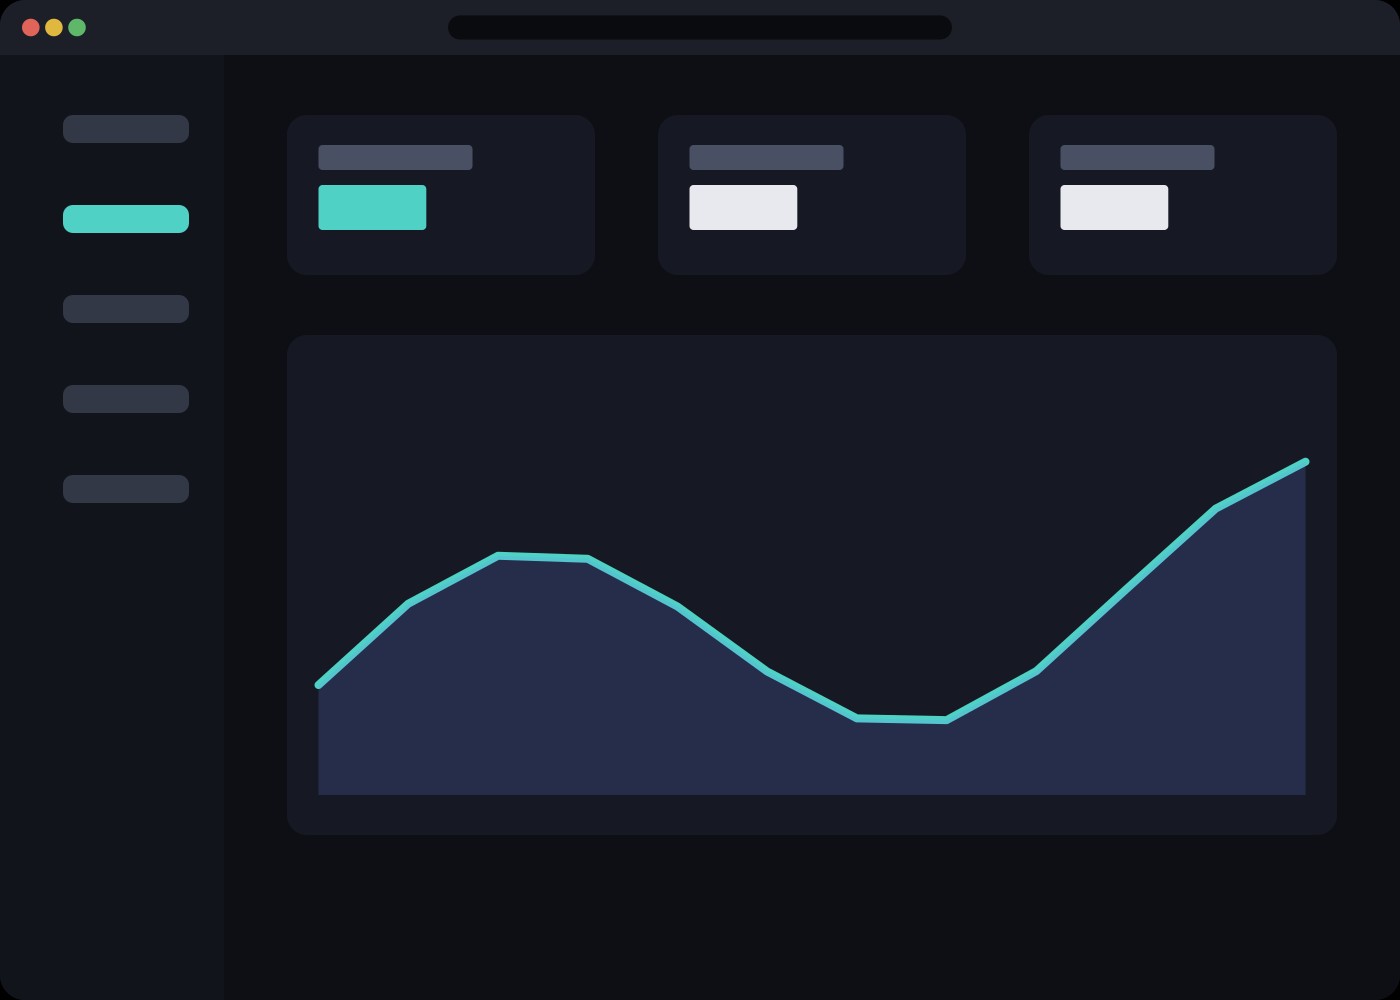
A true dark mode, not an inverted light one — tuned so a chart axis stays readable at 2am without the glare.